
Spot the Bitcoin Bubble
bubble, burst, crash, fun, graph, quiz
3 Comments
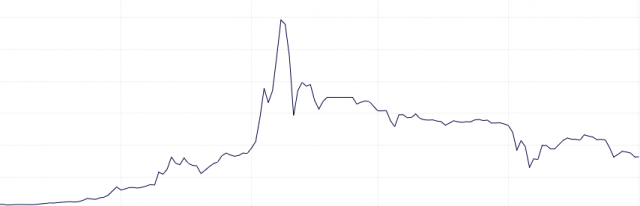
Here’s a fun little quiz: which graph is a bitcoin bubble of 2011, which graph is the bitcoin bubble of 2013, and which is a graph showing textbook definition of a bubble?
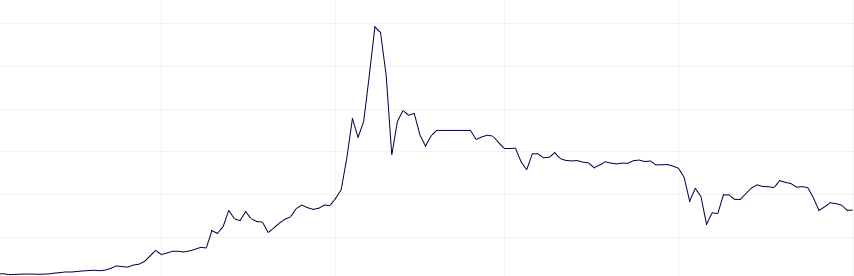
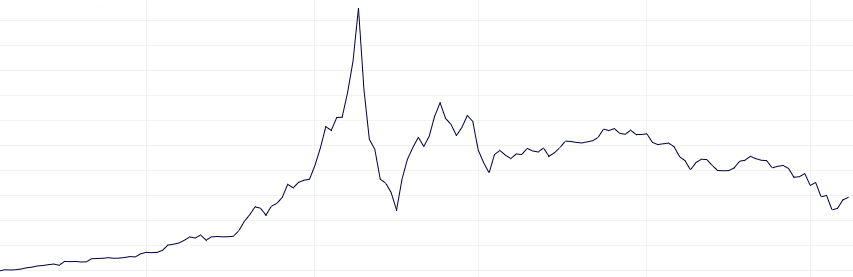
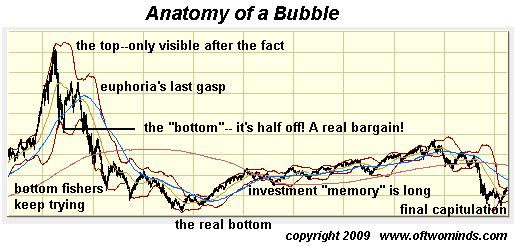
Winners will receive 1 swift kick in the ass from myself and a lifetime supply of Mellow Yellow.


July 8, 2013 @ 3:45 pm
My favorite thing is how Bitcoiners use linear graphs during growth and log graphs when value is going down. Maybe you could do a post on that?
July 8, 2013 @ 4:26 pm
Good idea, I’ve mentioned it in passing before. My other favorite quirk is when the price is booming Bitcoin is an amazing investment but when it’s falling then Bitcoin is mearly a currency.
July 9, 2013 @ 3:43 am
I’m glad I traded the few bitcoins I messed around with (to see what the fuss was about) for something far more useful and stable… Minecraft license gift codes.